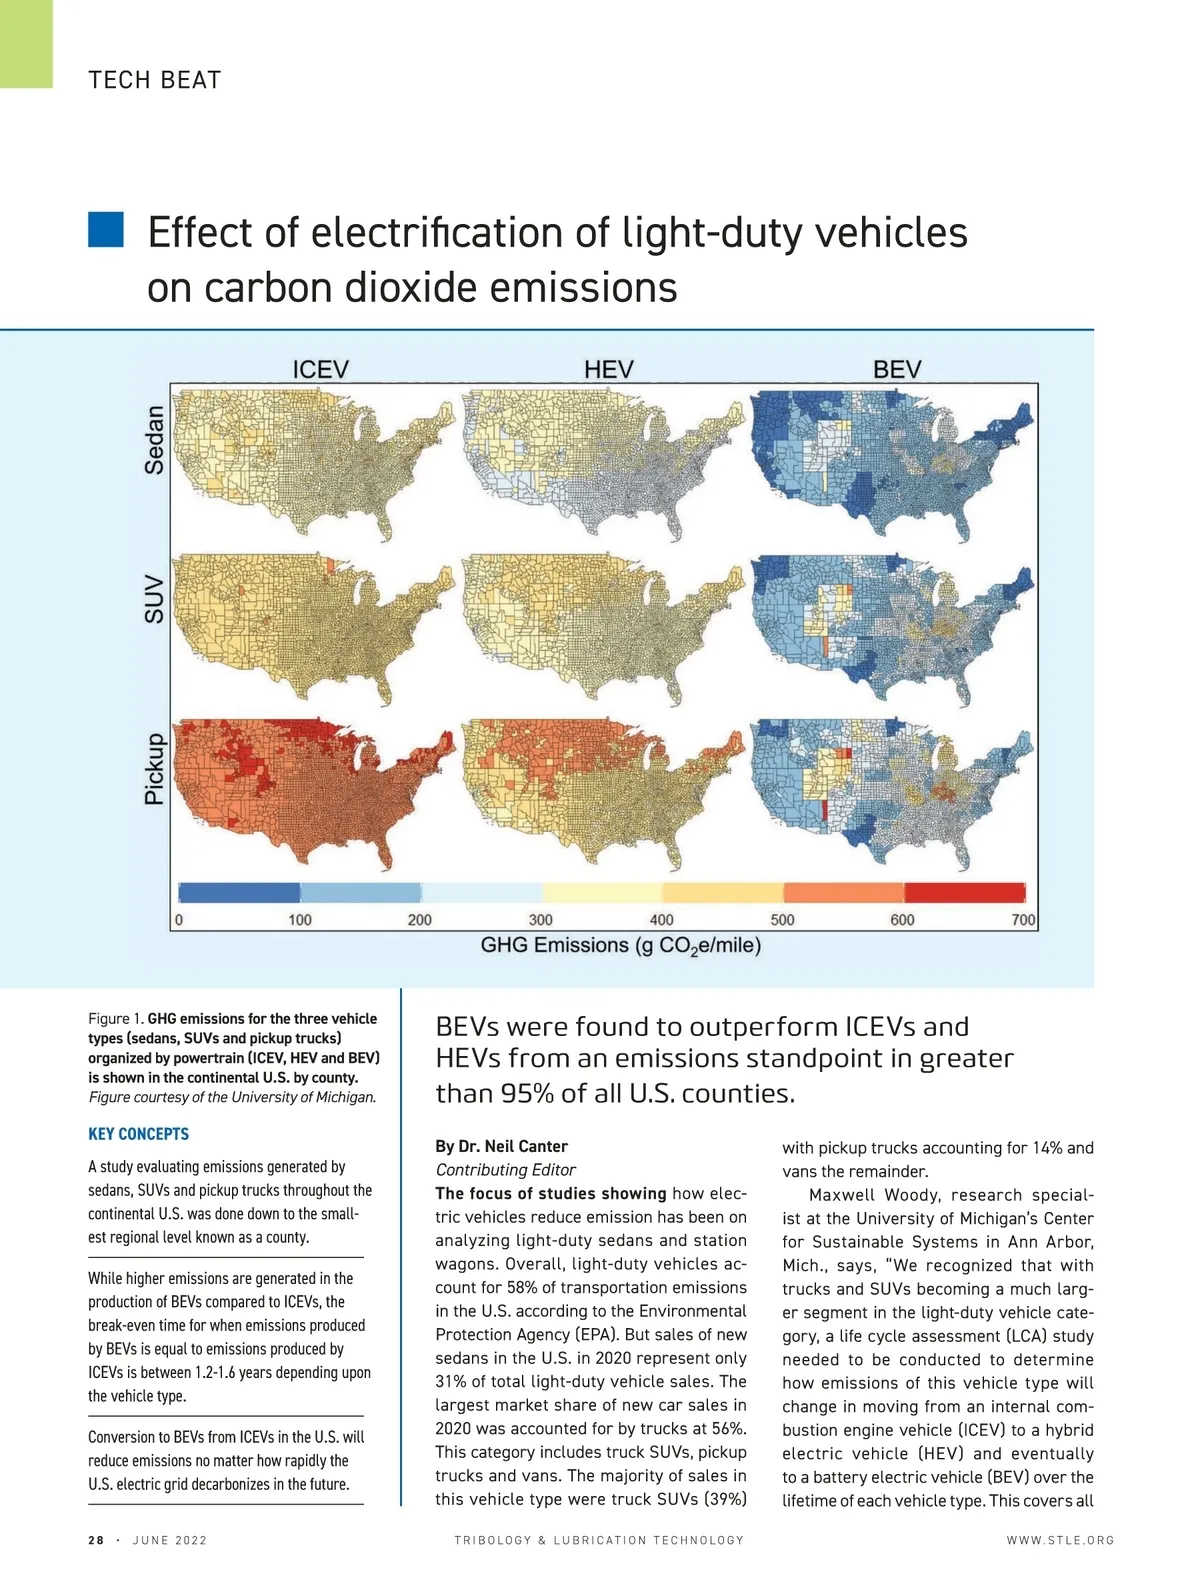
emissions attributed from the manufactur-ing of these vehicles (including sourcing of the raw materials used in their production) until the end of their operating life.” Woody and colleagues from the Uni-versity of Michigan and Ford Motor Co. conducted such a study that involved an evaluation of emissions generated by se-dans, SUVs and pickup trucks throughout the continental U.S. during the lifetime of these vehicles. Woody says, “We utilized fig-ures prepared by the U.S. National Highway Traffic Safety Administration for the aver-age distance that each vehicle type covered during its operating lifetime. Sedans are es-timated to operate for 290,000 kilometers, while SUVs and pickup trucks operate for 320,000 kilometers.” This analysis was done down to the smallest regional level in the U.S., which is a county. There are 3,108 counties present in the continental U.S. The researchers factored in such vari-ables as temperature, electric grid emis-sions in a specific county attributed to the source of power generation and driving pat-terns. Woody says, “Temperature is a more significant factor for BEVs than the other vehicle types because batteries prefer to operate at ambient temperatures between 16 C and 24 C. Battery performance suffers above and below this temperature range. We used a linear approach to show that battery performance will decrease propor-tionally as the temperature deviates from the desired range.” Electric grid emissions are another pa-rameter that need to be taken into consid-eration. Woody says, “We utilized a model developed by the National Renewable Ener-gy Laboratory (NREL) known as Cambium that projects power generation emissions by region.” Driving patterns need to be accounted for because electric vehicles display better performance and lower emissions in urban environments compared to ICEVs. In con-trast, rural locations are of more benefit for ICEVs due to higher fuel economy figures and concern about the driving range of BEVs between charges. Woody says, “For each U.S. county, we de-termined the ratio of city to highway driving as the way to estimate the percentage of driving in urban versus rural environments.” WWW.STLE.ORG The researchers used two models to obtain the information required to do the study. Woody says, “The Autonomie mod-el simulated energy consumption for the three vehicle types using the three pow-ertrain options. Data on materials, manu-facturing and end-of-life-emissions were obtained using the GREET 2021 model.” The researchers factored in such variables as temperature, electric grid emissions in a specific county attributed to the source of power generation and driving patterns. Different performance categories also were examined by the researchers. In the base case, BEVs with a range of 480 kilo-meters between charges were used while other battery ranges that included 640 ki-lometers and 320 kilometers also were an-alyzed. Woody says, “Emissions for batter-ies increased with range due to the greater weight, which means that more intensive manufacturing is required. Our analysis shows that a battery with a range of 480 kilometer has a 16%-17% lower emissions rate than one with a 640 kilometer range.” With battery manufacturing being such an important parameter in judging the LCA for BEVs, the researchers also determined the break-even time, which represents when emissions for BEVs will be equal to those of ICEVs and HEVs. Woody says, “Higher emissions are generated in the pro-duction of BEVs compared to ICEVs. This is due to the processes used in the manufac-ture of batteries. It is estimated that dou-ble the greenhouse gas (GHG) emissions are produced in the manufacture of BEVs compared to ICEVs. When in use, ICEVs dis-play higher emission levels than BEVs. The break-even time for BEVs is 1.2-1.3 years for sedans, 1.4-1.6 years for SUVs and 1.3 years for pickup trucks.” The researchers found that for the three vehicle types studied, BEVs have a 64% low-er cradle-to-grave life cycle emissions in sedans than ICEVs in the base case. HEVs have a 28% lower cradle-to-grave life cycle emissions than ICEVs in the base case. The carbon dioxide emissions benefit for BEVs TRIBOLOGY & LUBRICATION TECHNOLOGY over ICEVs is 45 metric tons of carbon diox-ide for sedans, 56 metric tons for SUVs and 74 metric tons for pickup trucks. Figure 1 shows the life cycle GHG emis-sions for all three vehicle types across the continental U.S. Woody says, “Our data shows a significant variation on emissions for each vehicle type based on location and timing for when a BEV is charged. The rea-son is due to the impact of ambient tem-perature on vehicle efficiency, the variabili-ty of the electric grid and the type of power generation used in each specific region of the U.S. But clearly, BEV displays lower emissions meaning that the move to elec-trification of vehicles will lead to an overall reduction in carbon dioxide emissions.” The researchers determined that BEVs outperform ICEVs in 98%-99% of all U.S. counties and outperform HEVs in 95%-96% of all U.S. counties from an emissions standpoint. Woody says, “We estimate that conversion to BEVs will reduce emissions no matter how rapidly the U.S. electric grid decarbonizes in the future.” Future work will involve evaluating how emissions will change by 2030 when BEVs are expected to represent 50% of all new vehicle sales in the U.S. Additional infor-mation can be found in a recent study 1 or by contacting Greg Keoleian, professor at the University of Michigan School for Environ-ment and Sustainability and director of the Center for Sustainable Systems. Keoleian is a co-author of the study and can be reached at gregak@umich.edu . REFERENCE 1. Woody, M., Vaishnav, P., Keoleian, G., Kleine, R., Kim, H., Anderson, J. and Wallington, T. (2022), “The role of pickup truck electrification in the decarbonization of light-duty vehicles,” Environmental Research Letters, 17 (3), 034031. JUNE 2022 • 29
Tribology and Lubrication Technology June 2022: Page 29